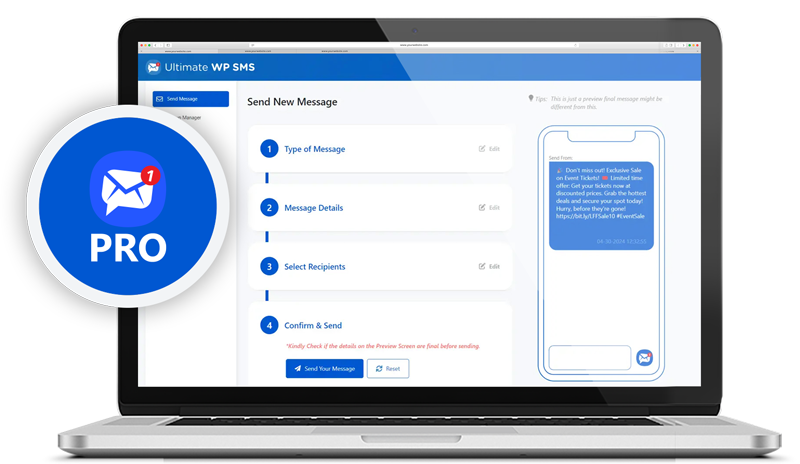


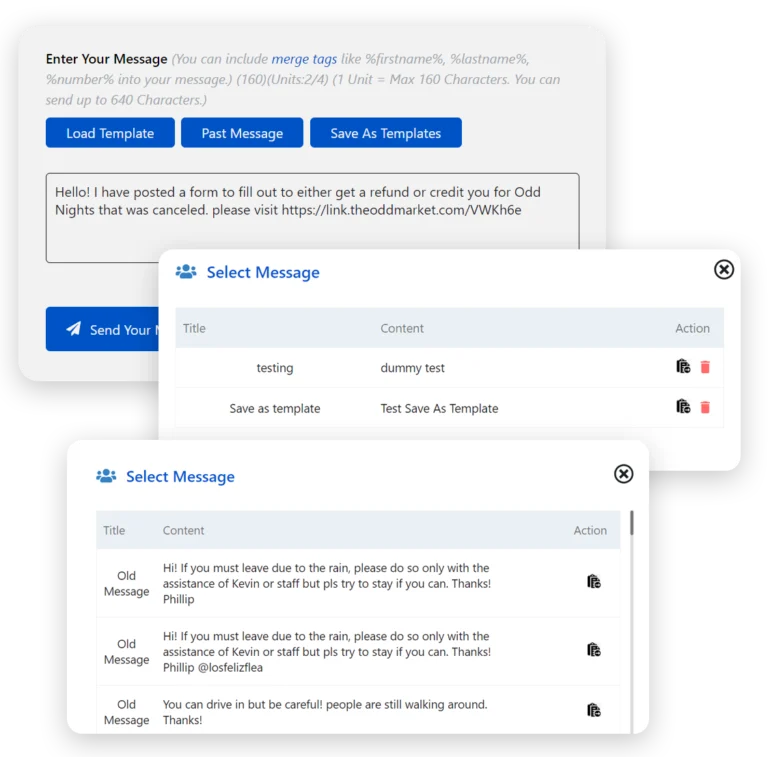
Create message in three different ways: SMS, MMS, Audio (Both recorded message or text-to-speech and can combine both).
Send & Receive SMS, MMS (US and Canada only) and text-to-voice/audio file messages to group or individuals.
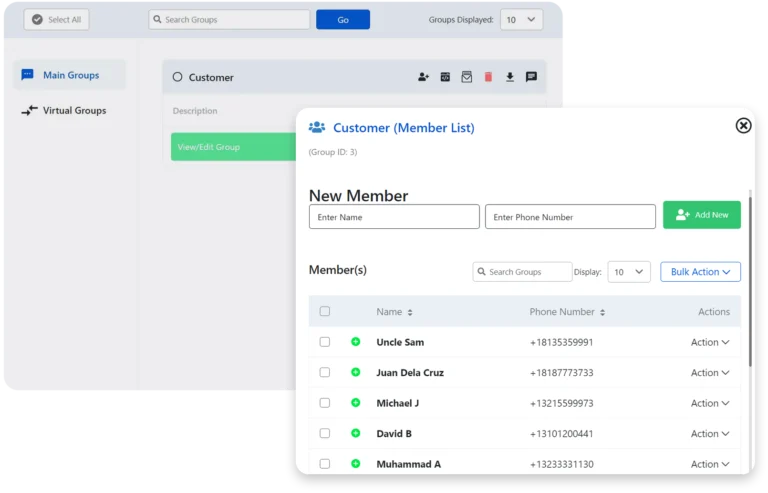
Create as many user groups as you want.
Opt in with keyword, shortcode or manually with customize message on getting added to the group.
Support for “opt-outs”, shortcode with customize message, so your subscribers can choose not to receive messages.
Invite form option.
Add a wide variety of merge tags to your messages.
Send auto-response ‘welcome’ messages to new subscribers.
Support for WordPress multisite networks and cross network activation of the plugin.
WordPress integration, 2fa, login with OTP, login with phone number as username, register with phone, create auto group by role.
Integration with the WordPress user database. Creating groups from existing WordPress roles and allowing you to use an existing phone number meta field.
Gravity Forms integration.
Create one or more subscription forms, using Gravity Forms or the built-in UWS forms, allowing website visitors to subscribe to SMS updates.
Receive notifications by SMS or email address, when you receive an SMS or new subscription.
Use a confirmation code with the built-in UWS forms during the subscription process.
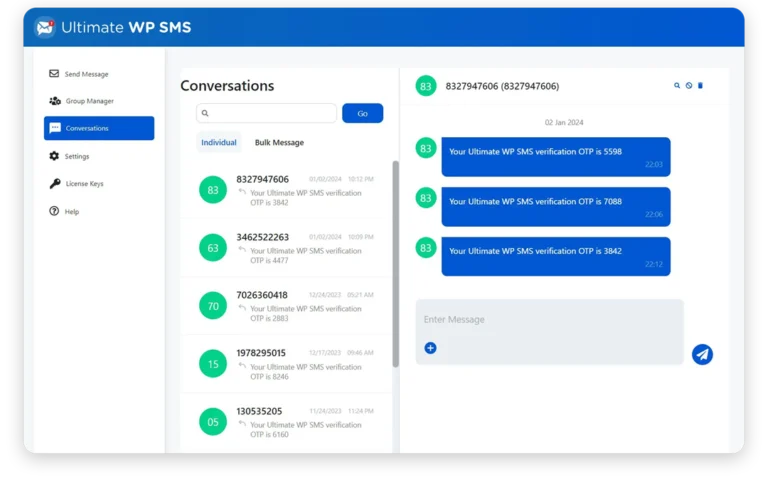
Two-way conversation where you can see incoming and outgoing message and you can reply directly from the conversation thread.
Woocomerce integration.
Sends SMS notifications for WooCommerce orders.
Allows you to send messages to your WooCommerce customer base.
Support for Unicode Characters including Emoji.
First class support for 12 months.
Upgrades for 12 months.
Continued development, adding features suggested by existing customers.